A big fat Gulab Jamun
Posted on October 7, 2011 | posted by: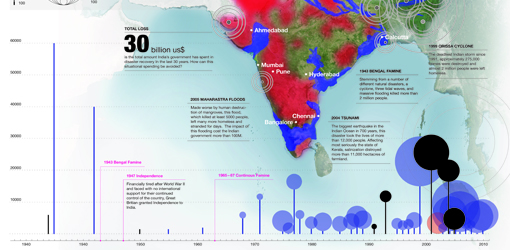
By Bernd Riedel and Christopher Patten
For transdisciplinary design to be successful, information must be clearly comprehended by all team members. With multiple backgrounds often approaching a project together, there are bound to be several languages being spoken. How can we develop a tool that has a common language in order that every team member may understand clearly and quickly the matter at hand?
In this situation, the infographic becomes a particularly useful tool. That’s because it develops a common language through the use of simple language and symbols. Applying the infographic to transdisciplinary design at the beginning of a project allows all team members to plant their feet on the same solid foundation of facts.
Our first studio project of the semester required us to think systematically about a particular country we would be investigating later in the fall. For us, that was India. The approach to this project was twofold. The first part, gathering our information and sifting through statistics, gave us a footing on which to base our second task: interpret and discover new connections statisticians couldn’t dream of calculating.
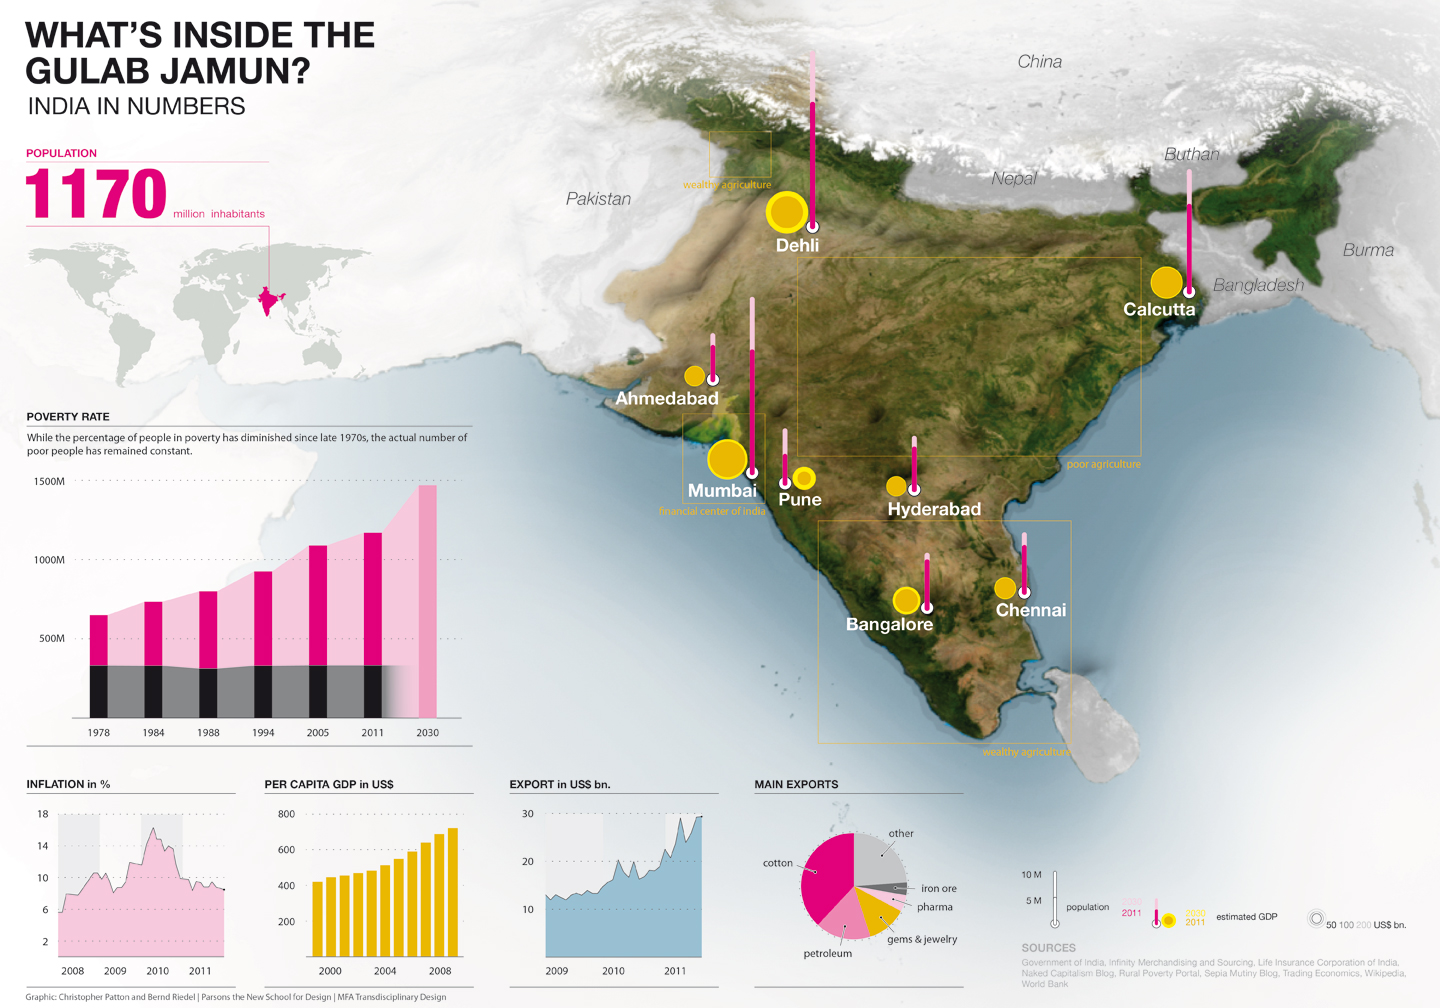
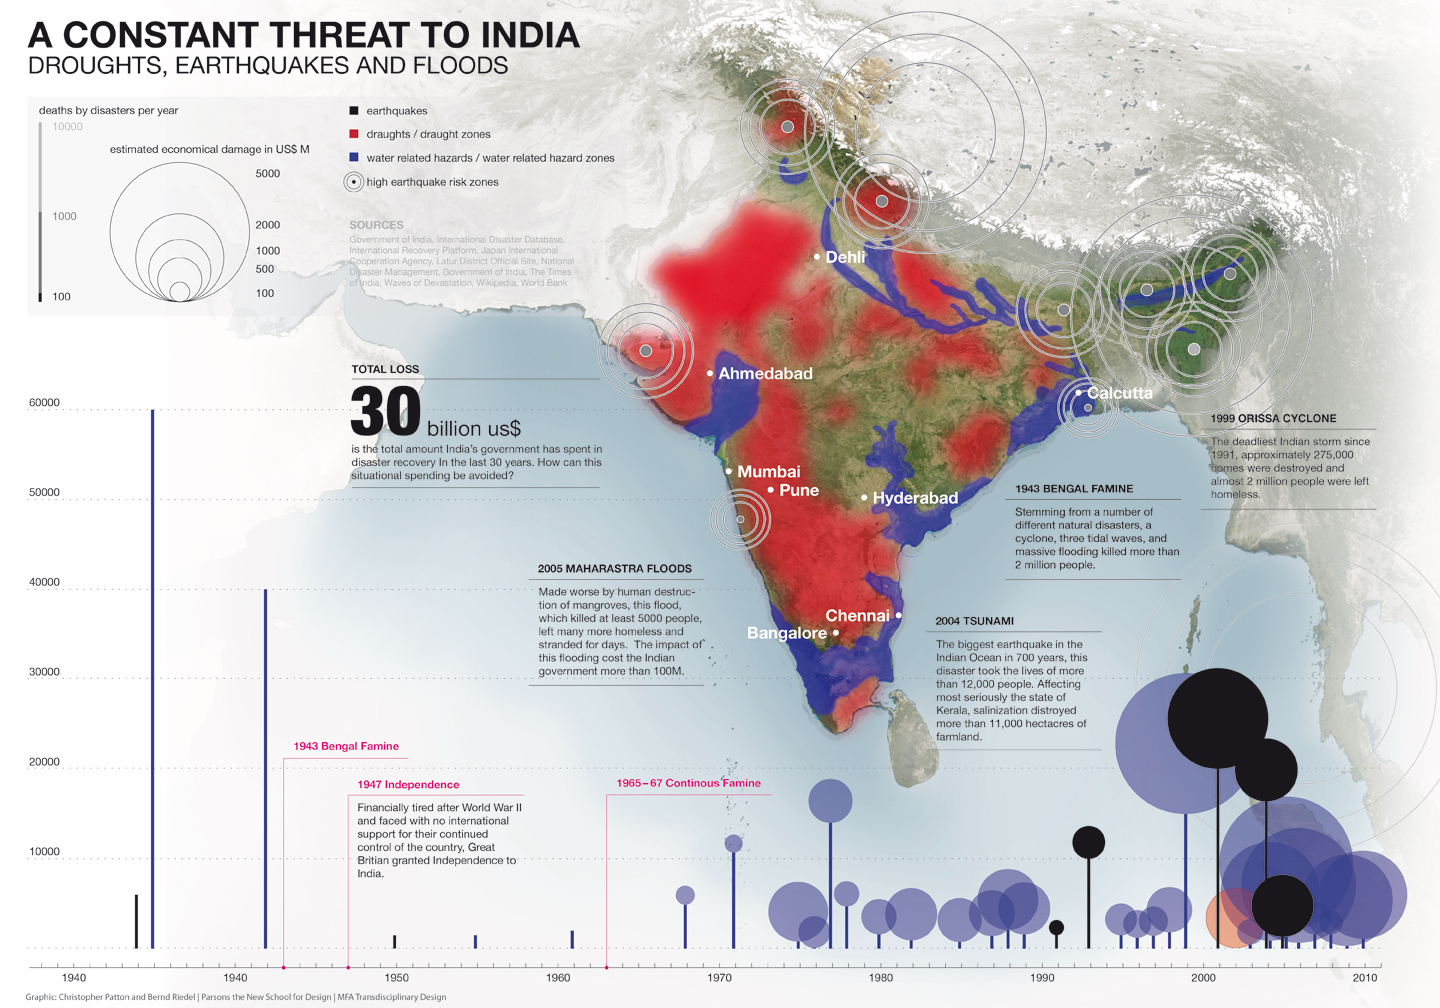
The first set of infographics for India are seen below. They include graphic interpretations of economic statistics, population, and natural disasters. Click on each graphic for a larger version.
The second part of our investigation required us to look into a set of cultural values that weren’t represented by statistics. Donella Meadow’s book, Thinking in Systems, showed us that by looking at each piece of research as a player in a large, interrelated system, we would make just the discoveries we had set out to find.
We started, then, by drawing a map of these cultural values. Soon we found ourselves drawing connections across the page and making connections we never thought existed. The most compelling example we discovered in this process was the relationship and narrative that existed around two subjects: gold and pride. Click on the graphic below for a larger version.
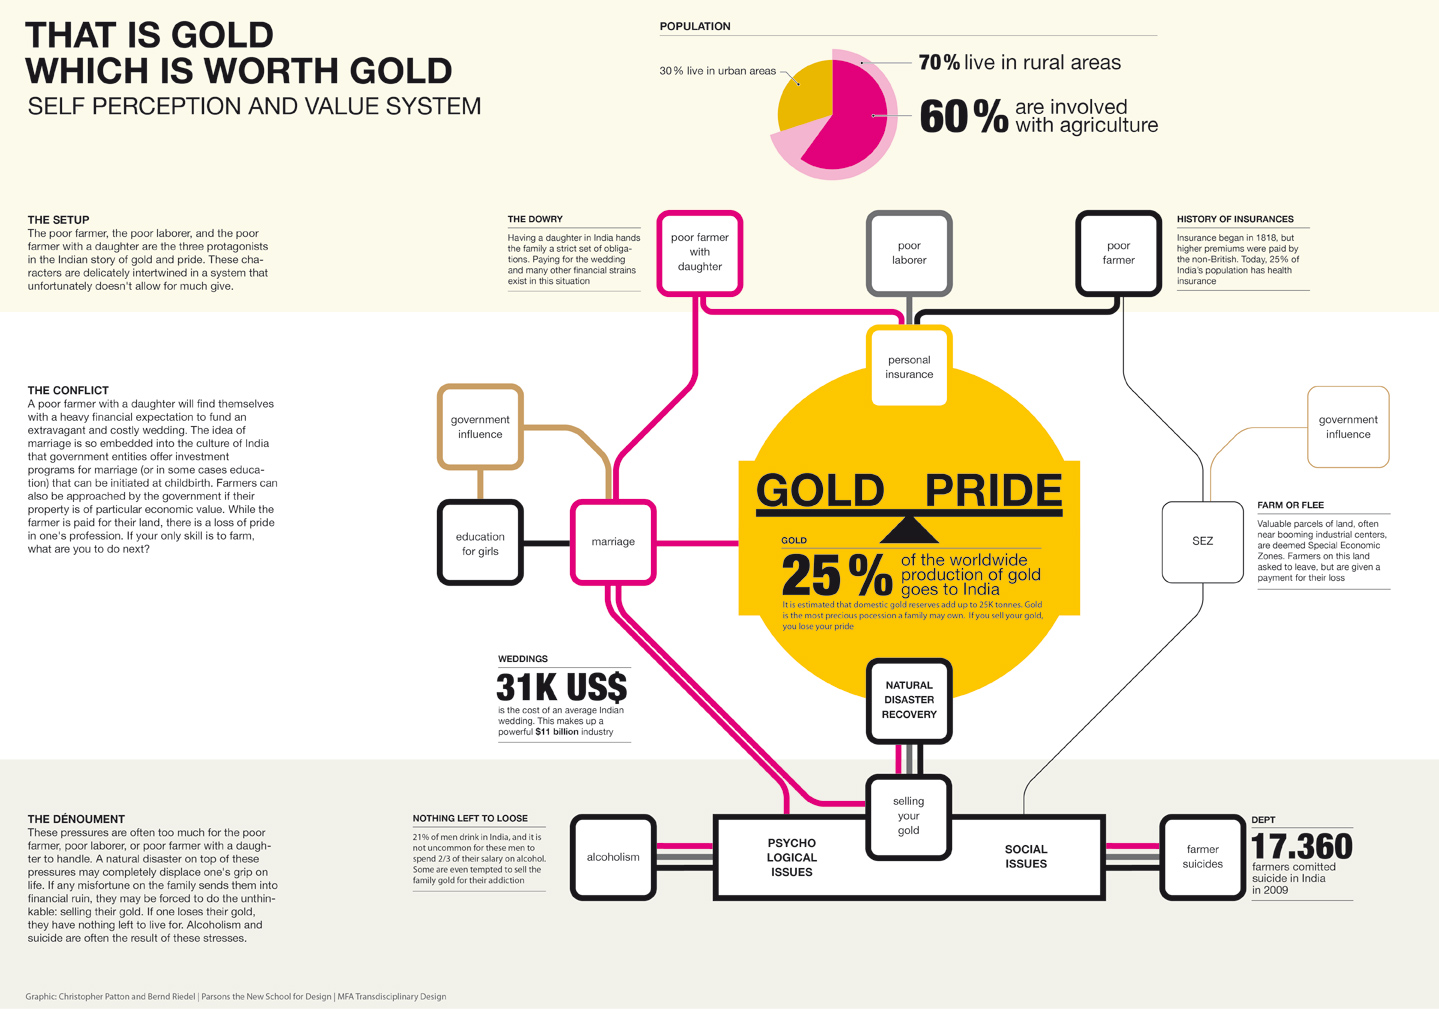
Around gold and pride are a series of reinforcing loops that put an enormous amount of pressure on families to protect their pride and gold. For example, a family with a daughter has a strong social obligation to have her married. A wedding for that daughter will cost — on average– about $31K. For a farming family, a natural disaster could destroy a lifetime of savings for that wedding, forcing the family to sell their gold. Selling one’s gold in India, however, is selling one’s pride, as gold is status. Even for an urban dweller, this churning cycle of poverty is present, as the recent. “Delhi on 32 Rupees a Day?”, an entry in the New York Times blog India Ink reported that a cobbler in New Delhi “spent all that [he] had on educating and marrying off [his] children.”
As Donella Meadows mentions in her book, “reinforcing loops are sources of growth, explosion, erosion, and collapse in systems.” She also mentions that a balancing loop “usually….will kick in sooner or later.” By all means, India cannot go on like this, and forces us to consider how that balancing loop, to combat the cycle of poverty, must be introduced.